Navigation Programs Chart Rendering Comparison
This is a work in progress (see changes made). Feedback and shots from unlisted programs (Instructions here) are welcome!By Jesper Weissglas (http://journeyman.se - jesper
 journeyman.se)
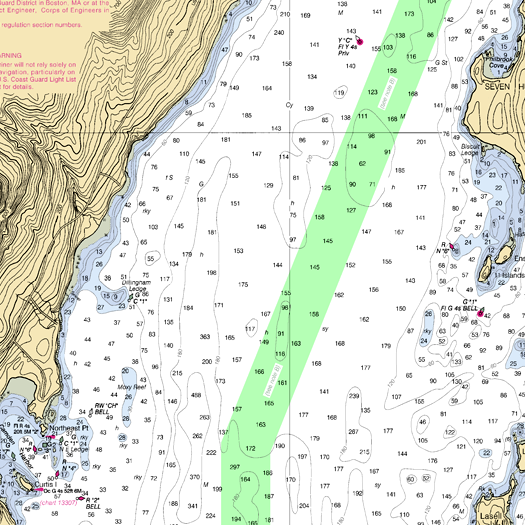
The above image show a rendering that I would consider "Best in Class". Well used antialiasing squeezes the maximum information into every screen pixel, which makes it possible to display a lot of detail and still have overview of a large area.
About this page
I started this project after some comments on the Panbo Blog .
.
Features of charting programs are discussed a lot. But chart graphics quality is often overlooked. This page attempts to fix this.
Only unscaled screenshots and lossless file formats have been used. I have attemted to get the same area covered, but all programs differ in how they treat zoom and scaling, and the screenshots have been made by different people. So the shots are not identical.
I am not affiliated with any of these companies. I am a Swedish boat designer who is very picky about the visual apperance of my charts.
Higher graphics quality means you can see a larger area without loosing detail. Which means quicker and more accurate planning.
If you take a look at where I grew up sailing or what racing in Sweden can be like you will understand ;-)
 =Raster
  =Vector
Start
ActiveCaptain
Coastal Expl.
Expedition
Fugawi
Garmin
MacENC
Nobeltec VNC
OpenCPN
PolarNavy
Tiki Navigator
TimeZero

This compilation is
Copyright © 2010 Jesper Weissglas. You are free to use it under the Creative Commons BY-NC-ND license. Contact me for other use.